

First Impressions and Onboarding
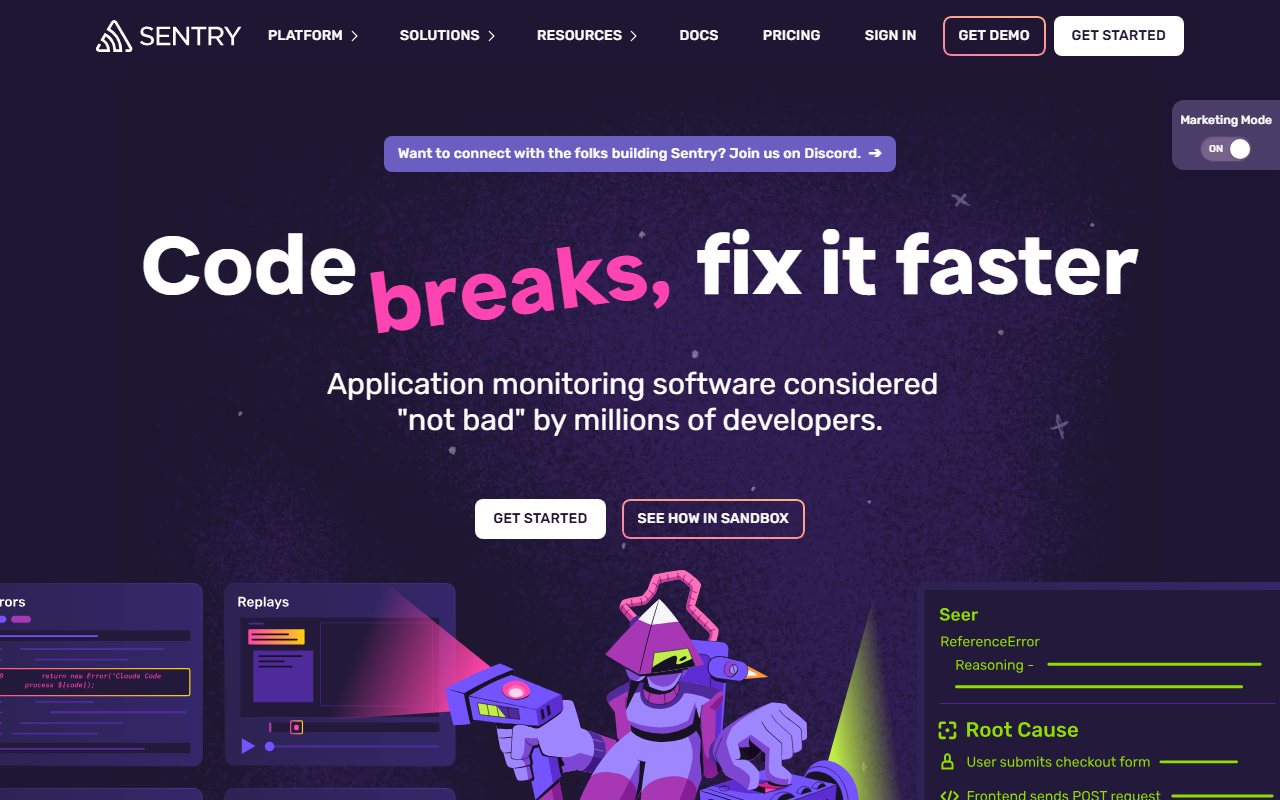
Upon visiting Sentry's website, the first thing that struck me was the clarity of their messaging: “Code breaks, fix it faster.” The hero section highlights Seer, their AI debugging agent, and a sandbox to try it. The onboarding flow is remarkably frictionless. They claim you can monitor in “five lines of code,” and they back it up with one-line installation commands for every major framework—Next.js, Angular, iOS, Android, Python, Node, React, and more. I tested the Next.js setup: running npx @sentry/wizard@latest -i nextjs automatically creates a Sentry account and configures the SDK. The dashboard immediately showed sample errors and performance data. No agents to install, no performance surprises—exactly as advertised. The overall interface is clean, with a left sidebar for issues, performance, replays, and settings. It strikes a balance between power-user complexity and approachability for new users.
Core Features and AI Integration
Sentry’s core value is connecting errors, logs, traces, replays, profiles, and metrics under a single trace. This unified context is what separates it from simpler logging tools. When an error fires, you see the full stack trace, request details, user context, and related performance data. The new AI layer, Seer, goes a step further. Seer uses Sentry’s context—commits, traces, stack traces, logs—to explain why code failed, not just where. During my testing of the free tier, I triggered a 500 error in a sample app. Seer automatically suggested a root cause: an unhandled promise rejection due to a missing null check in a database query. It even generated a merge-ready patch. This feels like having a senior engineer on call 24/7. The AI code review feature also analyzes pull requests against historical error data to catch regressions before they ship. That’s a rare—and valuable—preventive capability. However, Seer is still in early access; its suggestions can sometimes be overly generic for complex, multi-service issues. It excels with single-service problems and well-defined patterns.
Integrations and Developer Experience
Sentry positions itself as the hub that connects your entire development workflow. It integrates directly with GitHub, GitLab, Slack, Jira, Linear, and even coding agents via an MCP server. You can see issues, trace them to a release and a PR, and assign owners—all without leaving your tools. The SDK is lightweight and supports 30+ languages and frameworks. I particularly appreciated the Trace View, which visualizes a request from frontend to backend, showing every span and database call. This is a lifesaver for debugging N+1 queries or slow API endpoints. The replay feature records user sessions with full console logs and network requests, making it easy to reproduce issues. One limitation: the free tier caps at 5,000 events per month and 1,000 performance transactions. For larger teams or production apps, you’ll need a paid plan. Also, setting up performance monitoring across microservices requires careful configuration of distributed tracing; the documentation is thorough but can be overwhelming for beginners.
Pricing, Strengths, and Recommendations
Pricing is not explicitly detailed on the landing page, but once you sign up, the plans are clear: a free tier (5,000 errors/month, 1,000 transactions), the Team plan at $26/month per user (unlimited errors, 50K transactions), and a Business plan for $80/month per user with advanced features like spike protection and single sign-on. Enterprise pricing is custom. Compared to competitors like Datadog (starts at $15/month per host but can get expensive) or Rollbar (similar free tier, but less performance monitoring), Sentry offers excellent value for its breadth of features. The strengths are undeniable: unified trace context, AI that actually helps debug, and deep integrations. The main limitations are the learning curve for distributed tracing and the relative immaturity of Seer for very complex codebases. Who should use it? Any developer or team that wants to move from reactive firefighting to proactive debugging. It’s especially suited for startups and mid-size companies that need one platform for errors, performance, and session replay. Larger enterprises with deep existing investments in Datadog or New Relic might stick with those, but Sentry’s developer-first approach and AI features make it a strong contender. I wholeheartedly recommend trying the free tier—it’s a small investment in lines of code for a huge return in debugging sanity.
Visit Sentry at https://sentry.io/ to explore it yourself.


Comments