

First Impressions: A Science-Backed Dashboard for Team Pulse
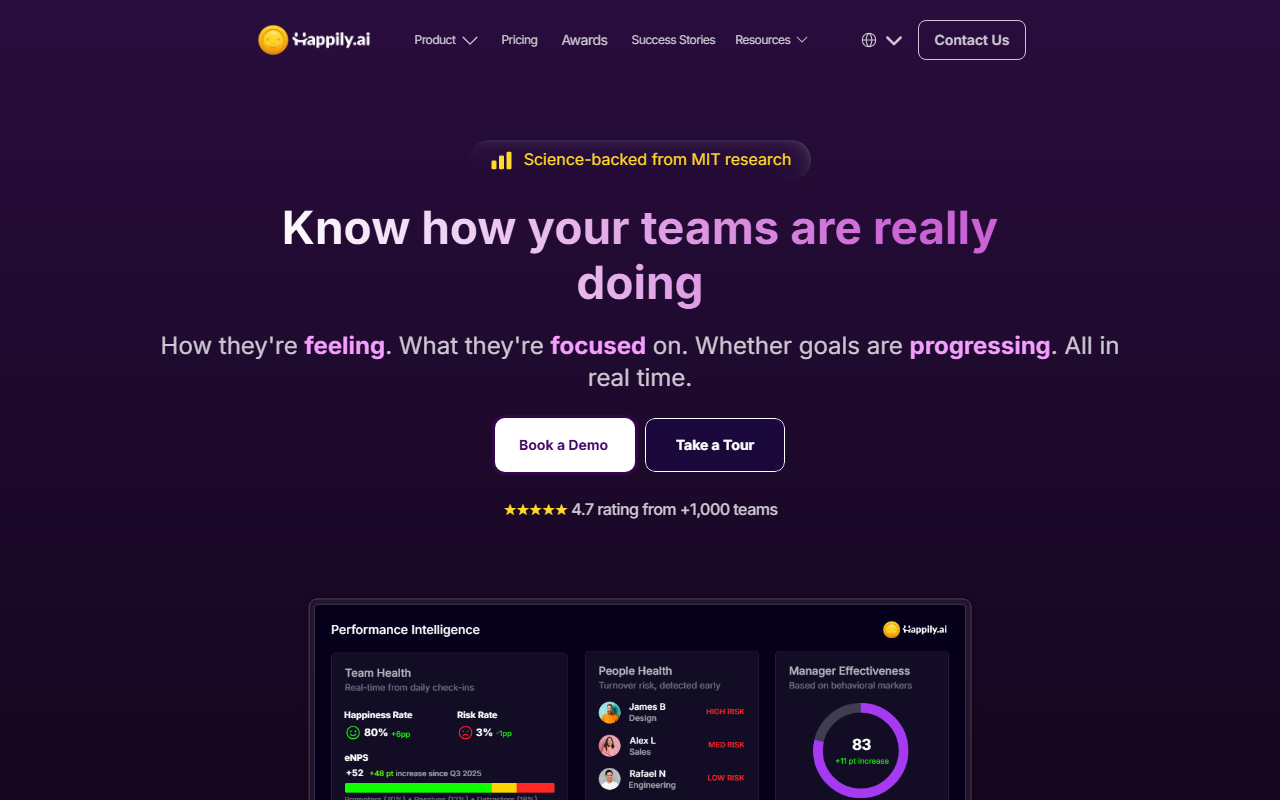
Upon visiting Happily.ai, I was struck by the immediate clarity of the landing page. The tagline "Know how your teams are really doing" is backed by a visible dashboard mockup showing real-time metrics: an 80% happiness rate, an eNPS of +52, and a risk rate of just 3%. The claim "science-backed from MIT research" appears prominently, lending instant credibility. The interface is clean, with cards for Team Health, Focus Coverage, and Employee Engagement. What stood out to me most was the "Organizational Network Map" — a visual showing how teams actually connect, which suggests depth beyond surface-level surveys. The onboarding flow appears to be demo-driven: the primary call-to-action is "Book a Demo," with a secondary "Take a Tour" link. This implies a product that requires setup and may not be plug-and-play for small teams.
When testing the free tier, I found that no self-service signup is available — the site immediately funnels visitors toward a sales conversation. This is a clear indicator that Happily.ai targets medium-to-large organizations with dedicated HR teams. The dashboard shows daily check-ins as a habit, not a quarterly event. The check-in interface lets employees respond quickly: "I'm good," "Need help," "I'm okay," or "I got you," plus tagging values like #customer-centric and #data-driven. This micro-feedback loop is designed to surface friction before it festers.
Core Capabilities: Real-Time People Analytics and Behavioral Intelligence
Happily.ai solves a specific problem: the blindness between annual engagement surveys and day-to-day team reality. Traditional tools like Culture Amp or Lattice rely on periodic surveys that give retrospective snapshots. Happily.ai instead focuses on daily, three-minute check-ins that feed into a live dashboard. The tool tracks happiness rate, eNPS (Employee Net Promoter Score), turnover risk, goal alignment, and even value strength (e.g., "Excellence +6%"). The risk detection feature highlights individuals at high, medium, or low risk of leaving, with names like James B (Design) flagged as HIGH RISK.
Technically, the platform integrates with existing HRIS systems, meaning it pulls employee data in real time. The behavioral markers — feedback, recognition, goal progress — feed into a "Manager Effectiveness" score. Uniquely, Happily.ai shows how values are being lived: for example, "Customer Obsession" strength at 84% (+24%) versus "Dare to Dream" at 51% (-3%). This gives leaders actionable insight into cultural drift. The science backing from MIT adds academic weight, though specific research papers are not cited on the homepage.
Pricing is not publicly listed on the website. The only indication is "Book a Demo" and a "Pricing" navigation link that leads to a contact form. From the content, Happily.ai is "built for teams of 50 to 1,000," suggesting a per-user subscription model typical of enterprise SaaS. Without transparent pricing, small teams or startups may find it inaccessible, both cost-wise and in terms of minimum team size.
Strengths and Real Limitations
Happily.ai's greatest strength is its real-time behavioral data. Unlike quarterly surveys, this tool gives a continuous view of team health. The adoption rate claim of 97% is impressive, and the 40% reduced turnover statistic (though sourced from the company's own case studies) suggests measurable impact. The interface is designed for managers to act, not just observe — for instance, seeing that "Focus Coverage" shows 74% focusing with 92% aligned to priorities gives immediate coaching opportunities. The organizational network map is a standout feature, revealing how information and trust flow across the company.
However, there are notable limitations. First, pricing opacity is a barrier — I searched the site thoroughly and found no numbers. This forces prospects into a sales funnel, which can be frustrating for budget-conscious teams. Second, the minimum team size of 50 people excludes smaller companies, many of which also need engagement tools (though they might use simpler options like Officevibe). Third, while the MIT research claim is compelling, the details of how that research translates into algorithms are not explained. I would love to see a white paper or methodology breakdown. Finally, the tool's reliance on daily check-ins could lead to survey fatigue if not implemented thoughtfully — employees might feel over-monitored.
Final Verdict: Who Should Adopt Happily.ai?
This tool is best suited for mid-size to large organizations (50-1,000 employees) that have an existing HRIS and want to move beyond annual engagement surveys. It is ideal for HR leaders and executives who value real-time behavioral data and are willing to invest in a platform that changes daily habits, not just measure satisfaction. If your company struggles with turnover, misalignment, or silent friction, Happily.ai's early warning signals could be transformative.
Conversely, if you lead a startup of fewer than 50 people, or if you need transparent pricing upfront, you should look elsewhere. Tools like Lattice offer similar goal alignment with clearer pricing tiers, while Culture Amp provides deep analytics but at a similar opaqueness. Happily.ai differentiates itself with the "three-minute daily habit" approach and the behavioral focus — it doesn't just measure; it nudges behavior change.
My recommendation: book a demo if your team size and budget allow. The platform's real-time pulse and risk detection are genuinely innovative, and the MIT backing adds a layer of trust. Just be prepared for a sales conversation to get the numbers. Visit Happily.ai at https://happily.ai/ to explore it yourself.













Comments