

Exploring Infographics.so: First Impressions and Onboarding
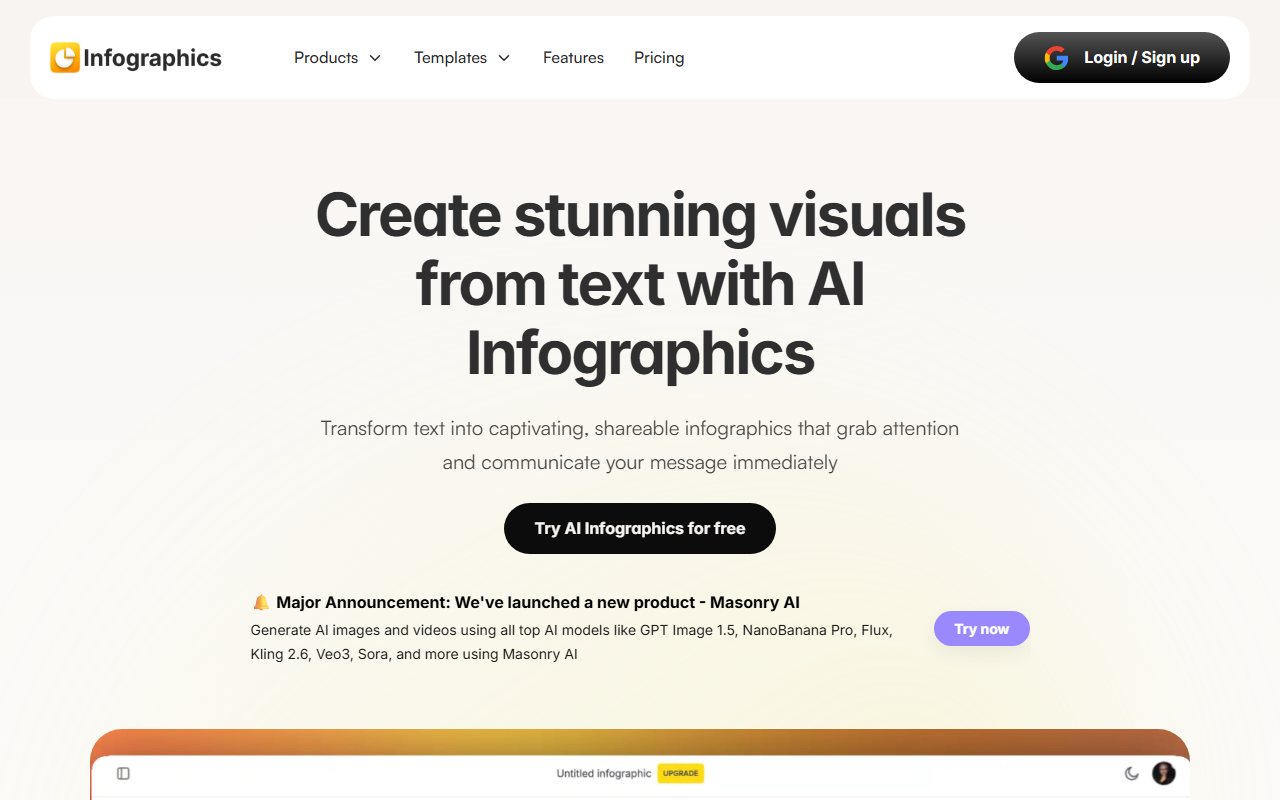
Upon visiting the site, I was greeted by a clean, modern interface with a clear call-to-action: "Try AI Infographics for free." No credit card required, which lowered the friction for testing. The dashboard shows a straightforward layout: you input text or a topic, choose from template types (funnel, timeline, hierarchy, etc.), and the AI generates a visual. I tested the free tier with a simple prompt about customer journey mapping. Within seconds, I had a polished funnel diagram with editable sections. The editor is intuitive—drag-and-drop styling, color adjustments, and font changes. However, I noticed the free version limits exports to low-resolution PNG; high-res and vector formats likely require a paid plan.
Core Features and AI Capabilities
Infographics.so solves a common pain point: creating professional infographics without design skills or time. The tool offers ten distinct template types, including funnel diagrams, cyclic processes, step-by-step journeys, hierarchy charts, roadmaps, timelines, mind maps, numbered listicles, pipelines, and more. Each template intelligently structures your text into a visual hierarchy. The AI behind it—while not explicitly named—seems to parse key points and map them to the chosen chart structure. For example, a numbered listicle automatically turned my five bullet points into a clean, numbered graphic with icons. Key integrations are notably absent; there is no direct connection to Google Slides, Canva, or social media platforms. You must download the infographic and manually insert it elsewhere. The tool also recently announced Masonry AI, a separate service for generating AI images and videos using models like GPT Image 1.5 and Kling 2.6—but that's a different product, not part of this infographic tool.
Pricing, Limitations, and Market Position
Pricing is not publicly listed on the website beyond the "free" tagline. The free tier appears to allow a limited number of creations per month and low-resolution exports. Upgrading likely unlocks unlimited designs, high-res/vector exports, and priority support. Compared to established players like Canva (which now offers AI design but requires a subscription for advanced features) and Piktochart (a dedicated infographic tool with more manual control), Infographics.so sits in a niche of pure AI generation with minimal manual customization. Its strength is speed—you get a usable infographic in seconds. The limitation is that the output can feel generic; you lose the ability to fine-tune every element like you would in Canva or Adobe Illustrator. Additionally, the tool currently lacks team collaboration features, which is a drawback for agencies or enterprise users.
Final Verdict: Who Should Use Infographics.so?
Strengths: Extremely fast AI generation, no learning curve, and a good variety of template types suitable for marketing, education, and internal reports. The free tier is generous enough to test its value. Weaknesses: Limited customization compared to dedicated design tools, no integration with other platforms, and uncertain long-term pricing transparency. This tool is best suited for individuals—bloggers, marketers, teachers, and small business owners—who need a quick, polished visual without spending hours on design. If you require heavy customization, brand kit consistency, or collaborative editing, look at Canva or Visme instead. I recommend trying the free version for a few infographics; if the output quality meets your needs, the speed alone justifies a paid plan.
Visit Infographics.so at https://infographics.so/ to explore it yourself.













Comments