

First Impressions and Onboarding
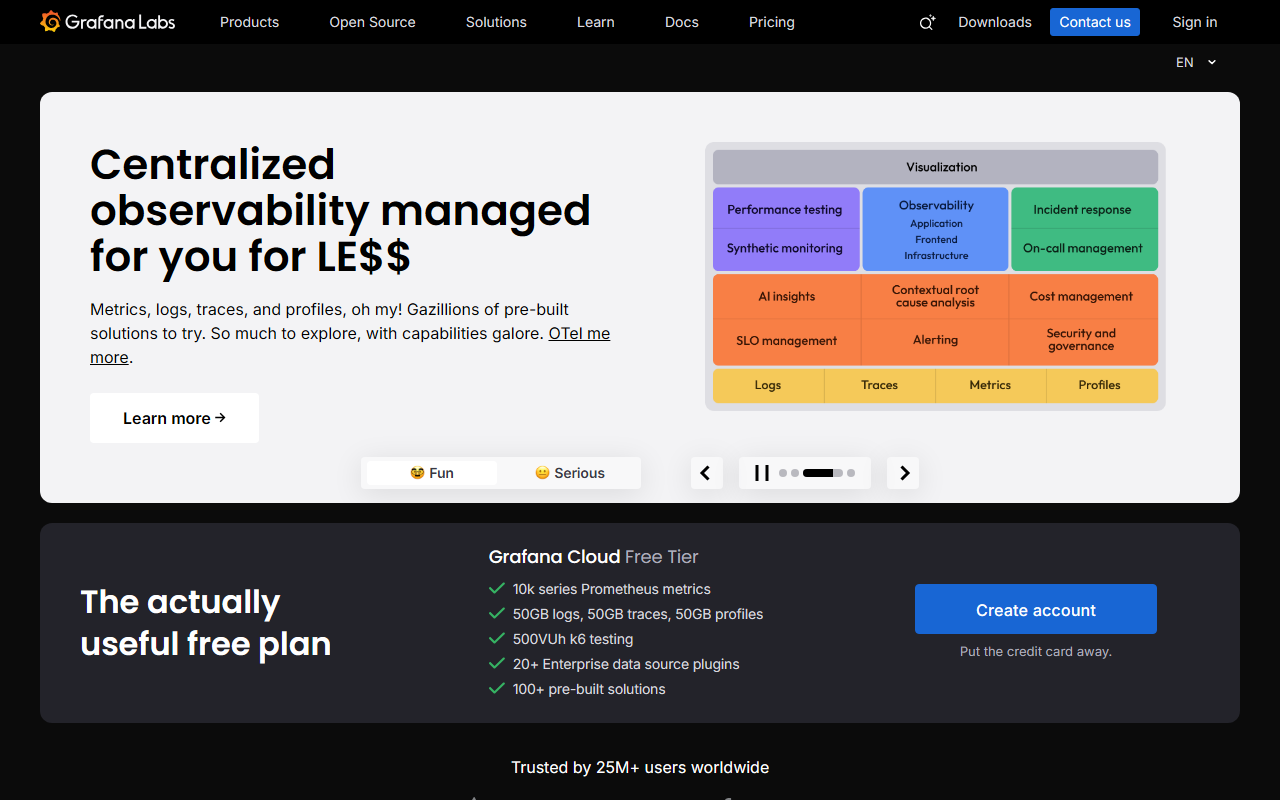
Upon visiting the Grafana website, the homepage immediately highlights "actually useful AI" — a bold claim in a market flooded with hype. The dashboard-like interface loads quickly, and the site offers a clear path to try Grafana Cloud with a Free Forever plan that includes limited access to the AI Assistant. I signed up and was prompted to create a new stack or connect existing data sources. The onboarding walkthrough suggests connecting sample data or using the built-in Grafana Play sandbox environment — no credit card required. Within minutes, I had a test dashboard up.
The AI Assistant appears as a chat icon in the lower-right corner of the Grafana Cloud interface. Clicking it opens a conversational panel where you can type natural language queries. I asked, "Show me CPU usage for the last hour" and it generated a PromQL query, executed it, and plotted a graph — all without me writing a single line of PromQL. The response time was under two seconds. The assistant also suggests follow-up questions, like "Compare with memory usage", making the workflow feel iterative and exploratory.
Core AI Features and Workflows
Grafana’s AI Assistant goes beyond simple query generation. It helps build dashboards from scratch: describe what you want to monitor, and it proposes panels, visualizations, and even alert rules. During testing, I typed "Monitor web server response times and error rates" and it created a multi-panel dashboard with latency histograms and error count graphs, linking to relevant logs and traces. This is a huge time-saver for teams new to observability or those overwhelmed by complex dashboards.
Another standout feature is Adaptive Telemetry, which uses AI to identify which metrics, logs, and traces are worth full-resolution storage versus aggregation. The website claims it can cut telemetry costs by up to 80%. While I couldn’t test that in the free tier, the concept addresses a genuine pain point: data volume inflation. The assistant also integrates with Incident Response & Management — you can ask it to summarize an ongoing incident or suggest remediation steps based on historical data. Deep model details aren’t public, but the AI clearly leverages foundational models trained on observability patterns and Grafana’s query language (PromQL, LogQL). No API or custom model prompt is exposed directly; everything runs within the Grafana Cloud environment.
Pricing, Integrations, and Market Position
Grafana Cloud offers a generous Free Forever plan that includes 10,000 series for metrics, 50 GB of logs, 50 GB of traces, and 100 user sessions per month — plus access to the AI Assistant for basic usage. Paid plans start at $29/month per workspace (Pro) and scale to Enterprise (custom pricing). The Free tier is ideal for small teams or personal projects. Grafana supports hundreds of integrations via plugins and connects to OpenTelemetry, Prometheus, and other open standards. Unlike proprietary competitors such as Datadog or New Relic, Grafana emphasizes open-source foundations and no vendor lock-in. However, the AI Assistant is only available in Grafana Cloud, not in the self-hosted open-source version, which limits its reach for users who prefer on-premise deployment.
Positioned as a leader in the 2025 Gartner Magic Quadrant for Observability Platforms, Grafana Labs serves everyone from startups to the Fortune 500. The company is privately backed (not publicly traded), with strong community-driven development. Its AI Assistant competes with Datadog’s Bits AI and New Relic’s Grok, but Grafana’s advantage is its unified approach across metrics, logs, traces, and profiles with a single chat interface.
Strengths, Limitations, and Verdict
Strengths: The AI Assistant genuinely accelerates common tasks — query generation, dashboard creation, and incident triage. Adaptive Telemetry promises real cost savings. The open-ecosystem design means you can keep existing tools. The free tier is generous enough to evaluate the AI seriously.
Limitations: The AI Assistant is cloud-only; self-hosted Grafana users cannot use it. It also struggles with highly custom or niche queries that require deep domain knowledge — I found it occasionally generated syntactically correct but logically flawed PromQL. For pure code generation or development tasks, Grafana isn’t a replacement for tools like GitHub Copilot. The AI model details are opaque, and there’s no offline mode.
Who should use this: SREs, DevOps engineers, and platform teams already using or considering Grafana Cloud. Also useful for teams looking to reduce telemetry costs and streamline incident response.
Who should look elsewhere: Users needing a code-generation AI for general programming, or those committed to on-premise observability stacks without cloud dependency.
Overall, Grafana’s AI Assistant is a practical, well-integrated tool that makes observability more accessible. It won’t replace expert knowledge, but it lowers the barrier to entry and speeds up daily workflows. Visit Grafana at https://grafana.com/ to explore it yourself.













Comments