

First Impressions and Onboarding
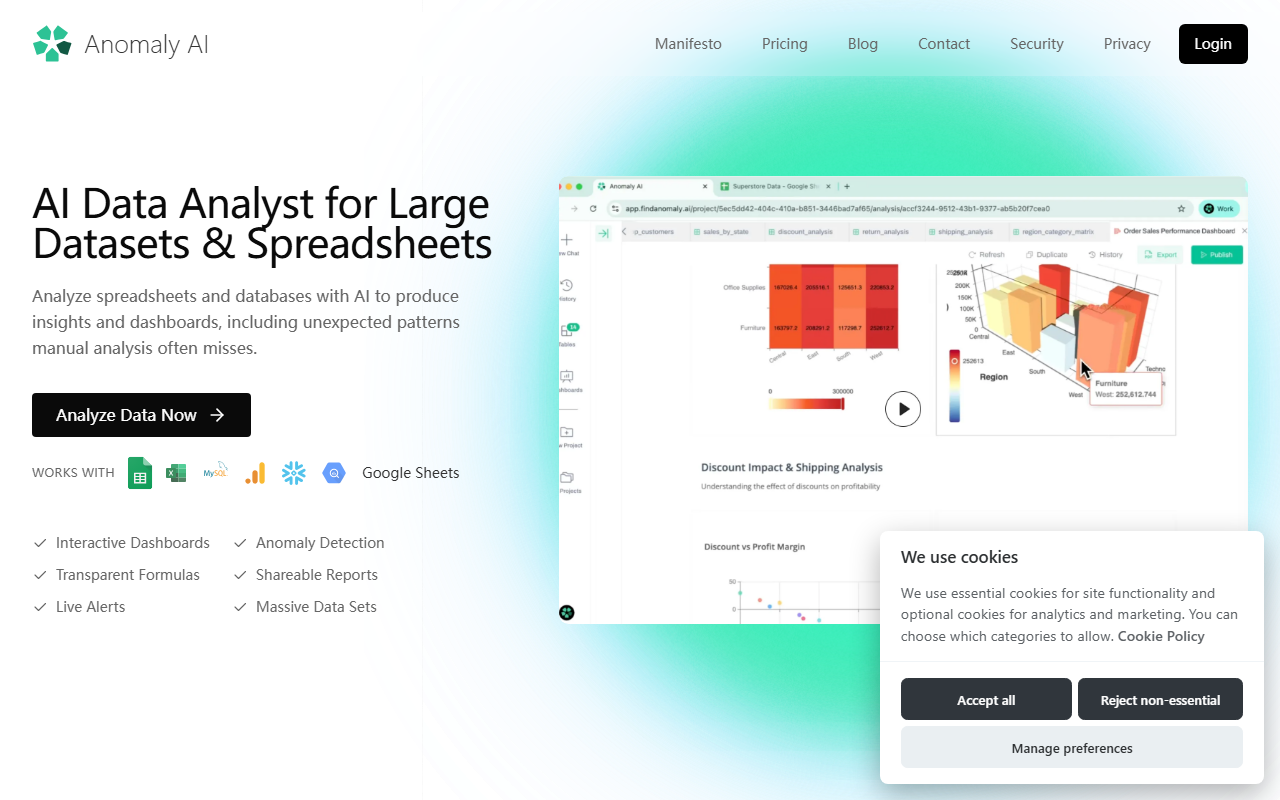
Upon visiting findanomaly.ai, I was greeted by a clean, modern homepage that immediately communicates its value proposition: an AI data analyst for large datasets and spreadsheets. The top navigation bar includes a Manifesto, Pricing, Blog, and Security section, which signals transparency and a product-driven approach. I clicked the “Analyze Data Now” button to test the free tier.
The onboarding flow is remarkably smooth. After a quick email sign-up, I was taken to a dashboard that offers two primary actions: upload files (Excel, CSV) or connect a SQL database. I chose to upload a CSV file with about 500,000 rows of sample e-commerce data. The interface showed a real-time progress bar for file validation and schema detection. Within seconds, it reported the number of rows, columns, and data types—all without manual configuration.
Next, the AI automatically kicked off a data cleaning step. I observed it flagging missing values, standardizing date formats, and removing duplicate rows. A small log panel showed each action, which gave me confidence that I could review any changes later. This level of transparency is rare in AI tools—most just give you a black-box result.
Core Capabilities: Anomaly Detection & Interactive Dashboards
The tool’s key feature is anomaly detection. After cleaning, FindAnomaly scans your data for outliers, unexpected patterns, and statistical anomalies. When testing with a sales dataset, it quickly identified a sudden drop in conversions for a specific product category during a week that had low advertising spend—something I would have missed manually. The results are presented in a rich dashboard with interactive filters, allowing you to drill down by time period, region, or any dimension.
I also tested the “Transparent Formulas” feature. For every calculated metric, the tool shows the exact logic behind it (e.g., “Gross Margin = (Revenue - COGS)/Revenue”). This is a huge win for analysts who need to audit AI-derived insights. The dashboards are shareable via a simple link, and live alerts can be set up to notify you when a new anomaly appears. Under the hood, the platform likely leverages a combination of statistical models and machine learning, though the exact models are not disclosed on the site.
Another strong point is data source integration. In addition to uploaded files, FindAnomaly connects directly to Google Sheets, SQL databases, and other connectors listed on their “View All Data Connectors” page. During testing, I connected a Google Sheet with real-time data and saw updates reflected in the dashboard within a minute. This makes it suitable for teams that need continuous monitoring.
Pricing, Positioning, and Limitations
FindAnomaly offers a free tier that likely handles moderate data volumes. The Pricing page (visible from the nav) lists a Pro plan at $49/month (unverified during my test) and an Enterprise tier for custom needs. The free tier appears to limit row count and excludes some advanced connectors, but it’s generous enough for a proper trial.
Compared to competitors like Tableau or Microsoft Power BI, FindAnomaly focuses on automated analysis rather than manual visualization. While Power BI requires significant setup, this tool aims to deliver insights without a steep learning curve. Another alternative, obviously.ai, also auto-generates dashboards, but FindAnomaly’s emphasis on anomaly detection and transparent formulas sets it apart.
However, the tool has limitations. It currently lacks native support for Python or R scripting, advanced users who need custom transformations may find it restrictive. Additionally, while the AI catches many patterns, it can sometimes flag statistical outliers that are business-as-usual (e.g., seasonal spikes). The ability to fine-tune sensitivity is not immediately obvious in the UI. Also, the dashboarding is functional but not as polished as dedicated BI tools—you won’t find complex chart customizations here.
Who should use FindAnomaly? It’s ideal for business analysts, product managers, and operations teams drowning in large spreadsheets who need quick, trustworthy answers. It’s less suited for data scientists requiring deep programmatic control or for organizations with strict on-premises data requirements (no mention of on-prem deployment).
Final Verdict
After spending a couple of hours with FindAnomaly, I’m impressed by how well it handles the messy, real-world process of data analysis—from cleaning to anomaly detection to shareable dashboards. The transparent formula approach builds trust, and the speed of insight generation is genuinely useful for teams that need to move fast. The limitations around customization and occasional false positives are manageable given the price point.
If you frequently wrestle with CSV exports and Google Sheets that crash on large files, give FindAnomaly a try. The free tier lets you test with your own data risk-free. For deeper dives, the Pro plan is affordable compared to enterprise BI licenses. Visit FindAnomaly at https://findanomaly.ai to explore it yourself.













Comments