

First Impressions and Onboarding
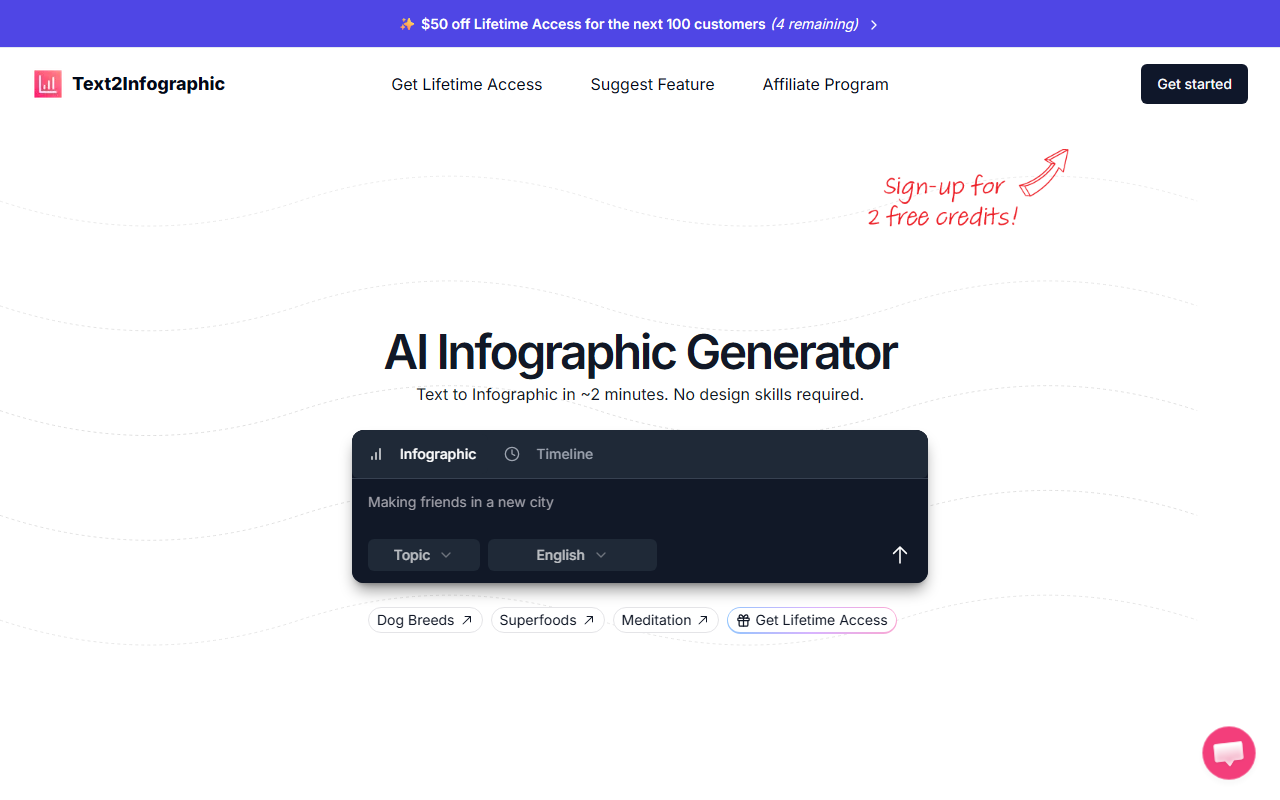
Upon visiting the Text2Infographic website, I was greeted with a clean, minimalist interface that immediately showcased sample infographics on topics like “Best beginner dog breeds” and “Benefits of meditation.” The homepage clearly explains the core value proposition: transform text into an infographic in roughly two minutes without any design skills. I clicked the “Prompt” input field and tried the built-in example “Dog Breeds.” Within seconds, the AI returned a polished infographic with icons, color-coded sections, and a timeline layout. The dashboard itself feels lightweight and intuitive—no account creation was required for the trial, which lowers the barrier for first-time users. The entire experience from text input to downloadable infographic took me under two minutes, matching the tool’s bold claim.
Key Features and Performance
Text2Infographic distinguishes itself by automating the entire design workflow. The AI analyzes your text, pulls relevant images automatically, and generates a professional layout with auto-citations. When I tested a custom prompt on “sources of air pollution,” the tool produced a clean infographic that included statistics and proper attribution—a rare feature in similar tools. The output quality is comparable to what a non-designer could achieve with templates in Canva or Venngage, but significantly faster. However, I noticed a limitation in customization: you cannot fine-tune the layout, fonts, or color palette after generation. The tool currently offers no export format options beyond what appears to be a PNG download. While the AI handles research and visual assembly well, power users seeking granular control will find it restrictive. The website claims over 67,755 happy users, which signals a growing user base, though detailed technical specs like the underlying AI model or API availability are not disclosed.
Pricing and Market Positioning
Pricing is not publicly listed on the website, but a prominent “Get Lifetime Access” button suggests a one-time payment model rather than a monthly subscription. This positions Text2Infographic against design giants like Canva (freemium) and Venngage (subscription-based). The tool’s marketing emphasizes a 99% cost saving compared to hiring a designer, claiming each infographic costs $1 or less. For budget-conscious content creators and small businesses, this is a compelling value proposition. However, the lack of transparent pricing details may deter some buyers; I recommend the developer add a clear pricing page. As of now, the lifetime access model is attractive, but users should verify what features are included in that tier (e.g., number of generations, resolution limits).
Who Should Use Text2Infographic?
This tool is best suited for bloggers, social media managers, and educators who need to produce one-off infographics quickly without a design background. The automated research and citation features make it particularly useful for data-driven content. Conversely, graphic designers and marketers who require advanced customization, multiple export formats (e.g., SVG, PDF), or brand consistency controls should look elsewhere. Text2Infographic excels at speed and simplicity but falls short on flexibility. The tool is a solid addition to any content creation toolkit, especially for users who value time over pixel-perfect control. Visit Text2Infographic at https://text2infographic.com/ to explore it yourself.


Comments